Vol. IAboutStandardsCorrectionsContact
PublickNo Strings Reporting

Economy

Announced as 7.83, corrected to 4.95 Million U.S. Jobs Added

From January 2023 through October 2026, the government first reported 7.83 million net new jobs. After its corrections, the count for those same months is 4.95 million. In 2025 alone, it first reported 1.21 million net new jobs. The count today is about 116,000.

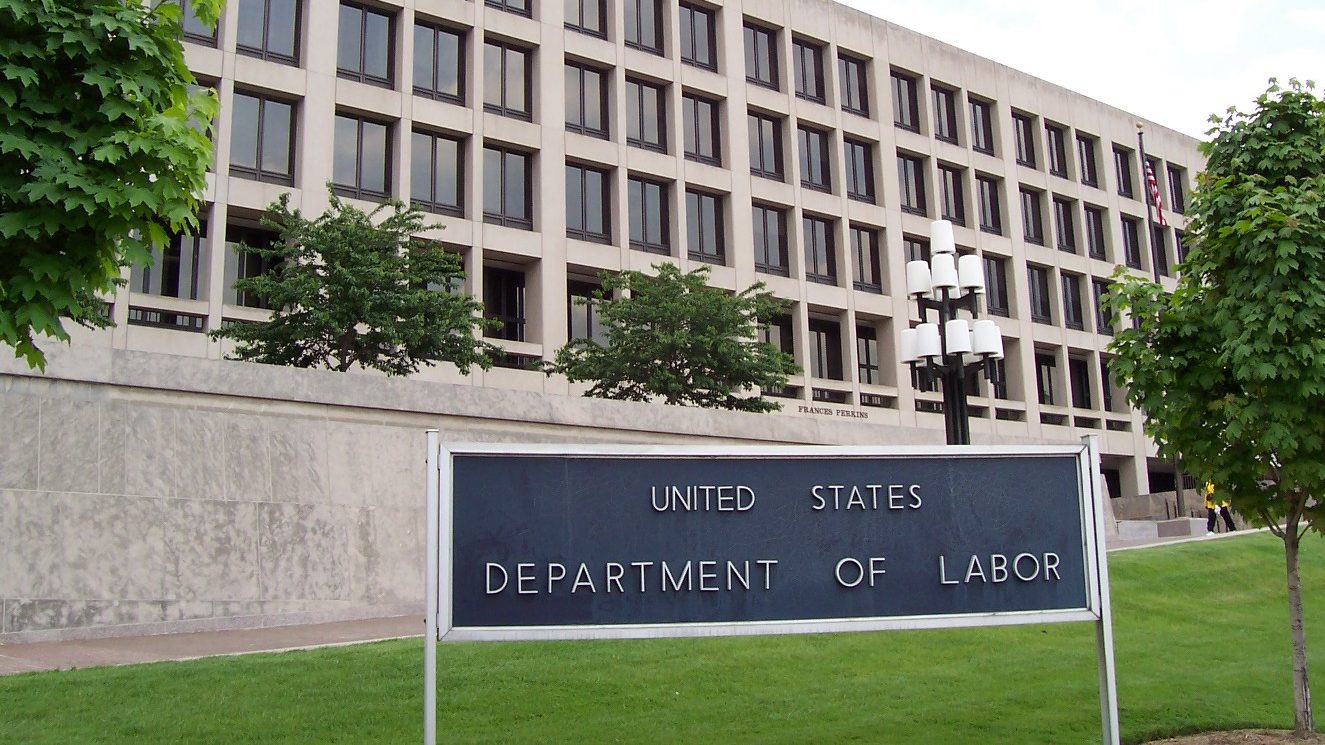
The U.S. Department of Labor sign in front of the Frances Perkins Building in Washington, D.C.
The Frances Perkins Building in Washington, D.C., headquarters of the U.S. Department of Labor, the department that includes the Bureau of Labor Statistics. Photo: Ed Brown, 2005, public domain, via Wikimedia Commons.

On November 6, the Bureau of Labor Statistics reported that employers added a net 165,000 jobs in October and that the unemployment rate fell to 4.1%. Net means jobs gained minus jobs lost; every jobs number in this story is a net number. Like every first report, that number is an estimate, and it will change.

Since January 2023, the first monthly reports have added up to 7.83 million net new jobs. After the government's own corrections, the count for those same months is 4.95 million, which is 2.88 million fewer. In 2025, the first reports showed 1.21 million net new jobs. The corrected count is 116,000.

How many net new jobs?

What they said firstAfter they fixed it
2023
Said first: 3,140,000
After fixing: 2,515,000
Jobs that were not really there: 625,000
2024
Said first: 2,589,000
After fixing: 1,459,000
Jobs that were not really there: 1,130,000
2025
Said first: 1,208,000
After fixing: 116,000
Jobs that were not really there: 1,092,000
2026January to October, so far
Said first: 893,000
After fixing: 861,000
Jobs that were not really there: 32,000

Source: Bureau of Labor Statistics. Net means jobs gained minus jobs lost. "After fixing" is the latest count after the monthly corrections and the yearly check against tax records. October 2026 has only its first report.

How the first number is made

The BLS builds the first number from a survey of employers. When the September number came out, about 53% of the employers in the sample had answered. For businesses too new to be in the survey, and for ones that have closed, the BLS uses an estimate called the birth-death model. The BLS changed that model in January 2026, and Federal Reserve Chair Jerome Powell said in 2025 that it had been overcounting jobs.

The next two monthly reports revise each first number. Every February, the BLS checks the past year against unemployment-insurance tax records that cover nearly every employer. The months from April 2025 on have not been through that check yet. The preliminary check for April 2025 to March 2026 points to about 79,000 fewer jobs.

Layoffs and hiring

The monthly jobs number is the net: what is left after hires and job losses cancel out. The BLS job turnover survey counted 1.64 million people laid off or fired in September 2026 alone, and 5.40 million people hired. A widely reported layoff total, from the firm Challenger, Gray & Christmas, is 617,000 for all of 2026 so far, because it counts only cuts that companies announce publicly.

Where the jobs are

In 2025, the whole economy added a net 116,000 jobs, and health care alone added a net 693,000. All other industries combined lost a net 577,000, which is why the total for the year is far smaller than the health care gain alone. From April 2025 to April 2026, health care added a net 618,000 jobs and all other industries together lost a net 367,000, according to Indeed Hiring Lab's reading of BLS data.

Who is out of work

In October, 7.1 million people were unemployed. 2.0 million of them had been out of work for 27 weeks or more, 27.6% of all unemployed. Another 4.8 million were working part time because they could not find full-time work, up 339,000 in one month. The BLS's broadest unemployment rate, which counts those groups, was 7.9%. For college graduates ages 22 to 27, unemployment was 5.6% in March 2026, according to the Federal Reserve Bank of New York.

Paychecks

After rising prices, average hourly pay was 0.7% lower in September 2026 than a year earlier, according to the BLS. For production and nonsupervisory workers, it was 0.6% lower.

The agency

The BLS ended its 2025 fiscal year with about 20% fewer staff than the year before, according to a December 2025 report on federal statistical agencies. It cut back price collection for the inflation report in 2025, and the administration's 2026 budget proposed cutting its funding for jobs and inflation data by about 8%. In June 2026, the Government Accountability Office reported that falling survey response rates are a risk to the accuracy of the jobs report. From August 2025 to August 2026, the agency was run by an acting commissioner; the timeline below shows who ran it, and when.

What comes next

The December 4 report revises October for the first time. The side-by-side numbers below show each part of this story in one place, and the timeline at the end shows every month since January 2023.

Side by side

One economy. Different numbers.

Each row asks one question and shows the answer from different counts of the same months. The first number is the one most often reported.

1How many net jobs were added?

January 2023 to October 2026, all months added together. Net means jobs gained minus jobs lost.

First reported by the BLS

7.83M

The total of every first monthly report, the numbers that made headlines.

Counted now by the BLS

4.95M

The same months after monthly revisions and the yearly check against tax records. That is 2.88M fewer.

2025 alone: first reported 1.21M, counted now 116K. Source: BLS Employment Situation reports and benchmark revisions; every month is in the timeline below.

2How many people lost their jobs?

Layoffs in 2026.

Announced layoffs (Challenger, Gray & Christmas)

617K

January to October 2026, all ten months. Counts only cuts that companies announce publicly. Smaller and unannounced layoffs are not counted.

Laid off or fired (BLS job turnover survey)

1.64M

In September 2026 alone, about 55,000 people a day. It was 1.79M in June, 1.70M in July and 1.77M in August. Counts layoffs and firings at all employers, announced or not.

Sources: Challenger, Gray & Christmas October 2026 report; BLS Job Openings and Labor Turnover Survey, September 2026 release (Nov. 3, 2026).

3How many people are out of work?

October 2026, except where noted.

Official unemployment rate (BLS, U-3)

4.1%

7.1M people with no job who looked for work in the past four weeks. About 1 in 24 people in the labor force.

Broadest BLS rate (U-6)

7.9%

Adds people who want work but stopped looking, and 4.8M people working part time who want full-time work. About 1 in 13.

Functionally unemployed (Ludwig Institute)

24.9%

July 2026, the latest month found. Adds people working full time who earn under $26,000 a year. About 1 in 4. Built from BLS survey data.

Sources: BLS Employment Situation, October 2026, Table A-15; Ludwig Institute for Shared Economic Prosperity, July 2026 True Rate of Unemployment.

4Where were the net jobs added?

Health care compared with every other industry.

Whole economy, net, 2025

+116K

Jobs gained minus jobs lost across every industry in 2025, after corrections.

Health care alone, net, 2025

+693K

Health care's net gain was larger than the whole economy's. All other industries combined had a net loss of about 577,000, which pulled the total down to 116K. From April 2025 to April 2026: health care +618K, all other industries −367K.

Sources: BLS via Fortune (2025 totals); Indeed Hiring Lab, May 2026 (April-to-April figures).

5Are paychecks keeping up?

September 2026 compared with September 2025.

Raise on paper

+3.0%

Average hourly pay for production and nonsupervisory workers, before prices. $32.60 an hour.

After prices

−0.6%

The same pay after inflation. For all private-sector employees: −0.7%. A paycheck buys less than it did a year ago.

Sources: BLS Real Earnings, September 2026 (Oct. 14, 2026); +3.0% via Trading Economics from the BLS release.

6Does a new job mean a full-time job?

How the payroll count treats hours and second jobs.

Part-time workers

28.58M

Average for 2026 so far, up from 26.98M in 2023. A 10-hour job counts the same as a 40-hour job in the monthly number.

People with two or more jobs

8.62M

Average for 2026 so far. Each job is counted, so one person with two jobs counts twice in the payroll number. Average workweek: 34.4 hours in October 2026, down from 34.6 in January 2023.

Sources: BLS household survey via FRED (LNS12600000, LNS12026619); BLS payroll survey via FRED (AWHAETP). 2026 is January to October; there is no October 2025 household data because of the shutdown.

7How is it for young college graduates?

March 2026.

All workers

4.3%

Official unemployment rate, March 2026.

College graduates ages 22 to 27

5.6%

Unemployment for recent graduates. About 41.5% of recent graduates worked jobs that do not require a degree.

Source: Federal Reserve Bank of New York, The Labor Market for Recent College Graduates, first quarter 2026; BLS.

8Do the government and a payroll company agree?

Two counts of the same private-sector jobs.

Business services, October 2026

BLS +70K

The BLS employer survey. ADP, which processes pay for more than 26 million private-sector workers, counted −27K for the same group.

Private jobs, September 2026

ADP +90K

ADP's first count, later +86K. The BLS first count for the same month was +46K. The two do not always disagree in the same direction.

Sources: BLS Employment Situation, September and October 2026; ADP National Employment Report, September and October 2026.

9Counting jobs or counting people?

Two BLS surveys, same months.

Payroll survey (jobs)

+29K

September 2026 first report, now +60K. October first report: +165K.

Household survey (people employed)

+406K

September 2026. October: +463K. Counts people, including the self-employed, and is the survey behind the unemployment rate.

Household survey changes are reported by Trading Economics and CNBC from the BLS release. The two surveys measure different things and swing differently month to month.

10Who answered the survey?

The first report for September 2026.

Employers who had responded

53%

About half of the employers in the BLS sample had answered when the first number came out.

When it gets checked

2028

Months from April 2025 on have not yet been checked against tax records. October 2026 is checked in the benchmark published in early 2028.

Source: BLS collection rates for the Current Employment Statistics survey; BLS benchmark schedule.

11How many layoffs show up as unemployment claims?

Weekly claims compared with monthly layoffs.

New unemployment claims

194K

One week, ending October 24, 2026. Close to the lowest level in 57 years.

Laid off or fired

1.64M

One month, September 2026, from row 2.

Not everyone who is laid off files a claim. In New York, New Jersey, Massachusetts, Ohio, Michigan and other states, severance paid as salary continuation delays unemployment benefits until the payments stop. Sources: U.S. Department of Labor via Reuters; state unemployment agencies.

Also: about 220 million LinkedIn members worldwide had "Open to Work" turned on in January 2025, up 35% from a year earlier, the latest figure LinkedIn has released. It counts people with the setting on, including people who have jobs, not people out of work. In the U.S., applicants for each open job on LinkedIn doubled from spring 2022 to January 2026. Sources: LinkedIn via CNBC, Jan. 23, 2025; LinkedIn News, January 2026.

The timeline

Every month since January 2023.

Each line shows the first net number reported, the net number now, and the difference. Net means jobs gained minus jobs lost. Firings, appointments and shutdowns are told in the month they happened.

2023

President Biden's third year. The BLS spent most of it under an acting head after the commissioner's term ended in March.

  1. JanFirst +517K now +434K−83K fewer Released Feb. 3. The first report showed 517,000 jobs, more than double the roughly 185,000 economists expected, and unemployment fell to 3.4%, the lowest since 1969.
  2. FebFirst +311K now +290K−21K fewer
  3. MarFirst +236K now +68K−168K fewer Commissioner William Beach's four-year term ends. Deputy Commissioner William Wiatrowski, a career BLS official, becomes acting head.
  4. AprFirst +253K now +241K−12K fewer
  5. MayFirst +339K now +280K−59K fewer
  6. JunFirst +209K now +225K+16K more
  7. JulFirst +187K now +163K−24K fewer July 12: President Biden nominates Erika McEntarfer, a labor economist with about two decades at the Census Bureau, to run the BLS.
  8. AugFirst +187K now +218K+31K more The preliminary yearly check against tax records shows about 306,000 fewer jobs for the year to March 2023.
  9. SepFirst +336K now +156K−180K fewer
  10. OctFirst +150K now +159K+9K more
  11. NovFirst +199K now +127K−72K fewer
  12. DecFirst +216K now +154K−62K fewer

Year end: first reported a net 3.14 million, now 2.52 million. That is 625,000 fewer.

2024

McEntarfer's first full year in charge, and an election year. Leaks of early data and a late release drew complaints about how the agency handles its numbers.

  1. JanFirst +353K now +175K−178K fewer McEntarfer is confirmed by the Senate 86–8 on Jan. 11 and takes office Jan. 29. Wiatrowski returns to deputy.
  2. FebFirst +275K now +206K−69K fewer A BLS economist emails non-public inflation details to a list of outside "super users." The final yearly check cuts the year to March 2023 by 187,000.
  3. MarFirst +303K now +228K−75K fewer
  4. AprFirst +175K now +64K−111K fewer
  5. MayFirst +272K now +78K−194K fewer May 15: inflation data is posted 31 minutes early.
  6. JunFirst +206K now +87K−119K fewer
  7. JulFirst +114K now +53K−61K fewer Released Aug. 2. It showed 114,000 jobs, below the roughly 175,000 economists expected, and unemployment rose to 4.3%, the highest since October 2021. That rise set off a recession warning known as the Sahm rule. On Aug. 5 the Dow fell about 1,000 points at the open.
  8. AugFirst +142K now +9K−133K fewer Aug. 21: the preliminary yearly check shows about 818,000 fewer jobs. It is released 34 minutes late, and some callers get the numbers early. Donald Trump, then the Republican nominee, accuses the Biden administration of manipulating the numbers.
  9. SepFirst +254K now +155K−99K fewer
  10. OctFirst +12K now +33K+21K more The report comes out Nov. 1, four days before the election.
  11. NovFirst +227K now +134K−93K fewer Trump wins the election Nov. 5.
  12. DecFirst +256K now +237K−19K fewer

Year end: first reported a net 2.59 million, now 1.46 million. That is 1.13 million fewer.

2025

Trump's first year back in office. Every month of 2025 was later revised down, and the BLS lost its commissioner in August.

  1. JanFirst +143K now −48K−191K fewer Trump takes office Jan. 20.
  2. FebFirst +151K now +42K−109K fewer The final yearly check cuts the year to March 2024 by 598,000.
  3. MarFirst +228K now +67K−161K fewer
  4. AprFirst +177K now +108K−69K fewer
  5. MayFirst +139K now +13K−126K fewer
  6. JunFirst +147K now −20K−167K fewer Within two months, June goes from +147K to −13K.
  7. JulFirst +73K now +64K−9K fewer Aug. 1: the report also cuts May and June by a combined 258,000. Hours later, Trump says he has ordered McEntarfer fired, accusing her of faking job numbers before the 2024 election. Wiatrowski becomes acting head again.
  8. AugFirst +22K now −70K−92K fewer Aug. 11: Trump nominates E.J. Antoni, chief economist at the Heritage Foundation. Sept. 9: the preliminary yearly check shows about 911,000 fewer jobs for the year to March 2025.
  9. SepFirst +119K now +76K−43K fewer Sept. 30: Antoni's nomination is withdrawn. Government funding runs out, and a 43-day shutdown, the longest on record, begins Oct. 1. This report, due Oct. 3, comes out Nov. 20.
  10. OctFirst −105K now −140K−35K fewer No report of its own. Its payroll count comes out with November's on Dec. 16, and the household survey is never collected, so October has no unemployment rate.
  11. NovFirst +64K now +41K−23K fewer Released Dec. 16.
  12. DecFirst +50K now −17K−67K fewer

Year end: first reported a net 1.21 million, now 116,000. That is 1.09 million fewer.

2026

The BLS stayed without a confirmed leader until August. Revisions in 2026 have gone both up and down.

  1. JanFirst +130K now +160K+30K more Jan. 30: Trump picks Brett Matsumoto, a BLS economist since 2015 on leave at the White House Council of Economic Advisers. A brief partial shutdown pushes this report from Feb. 6 to Feb. 11. The final yearly check, published in February, cuts the year to March 2025 by 862,000.
  2. FebFirst −92K now −156K−64K fewer
  3. MarFirst +178K now +214K+36K more
  4. AprFirst +115K now +148K+33K more
  5. MayFirst +172K now +63K−109K fewer The largest revision of any month in 2026. May 11: Matsumoto is formally nominated.
  6. JunFirst +57K now +31K−26K fewer June 10: Matsumoto's confirmation hearing. June 30: an Inspector General audit of the 2024 early releases finds the BLS reduced the risk but needs more safeguards.
  7. JulFirst −23K now −10K+13K more July 15: a Senate committee advances Matsumoto 12–11. Aug. 7: the report cuts May and June by a combined 103,000, and the Senate confirms Matsumoto 51–47 the same day.
  8. AugFirst +162K now +186K+24K more Aug. 11: Matsumoto takes office, ending a year without a confirmed commissioner.
  9. SepFirst +29K now +60K+31K more Only about 53% of employers had answered when this number came out. The preliminary yearly check for the year to March 2026 shows about 79,000 fewer jobs.
  10. OctFirst +165K now +165KNot yet revised Released Nov. 6. Its first revision comes Dec. 4.

Year so far: first reported a net 893,000, now 861,000. That is 32,000 fewer so far, January to October.